Pinning visualization to dashboard
After you have created a visualization or widget, you can pin it to the dashboards. Pinning a widget to a dashboard allows you to keep important visualizations and key metrics in a central, easily accessible location. This provides a quick overview of your data and helps you monitor performance at a glance without having to navigate to different reports or visualizations. It centralizes information for better monitoring and decision-making.
To pin a visualization to a dashboard, do the following:
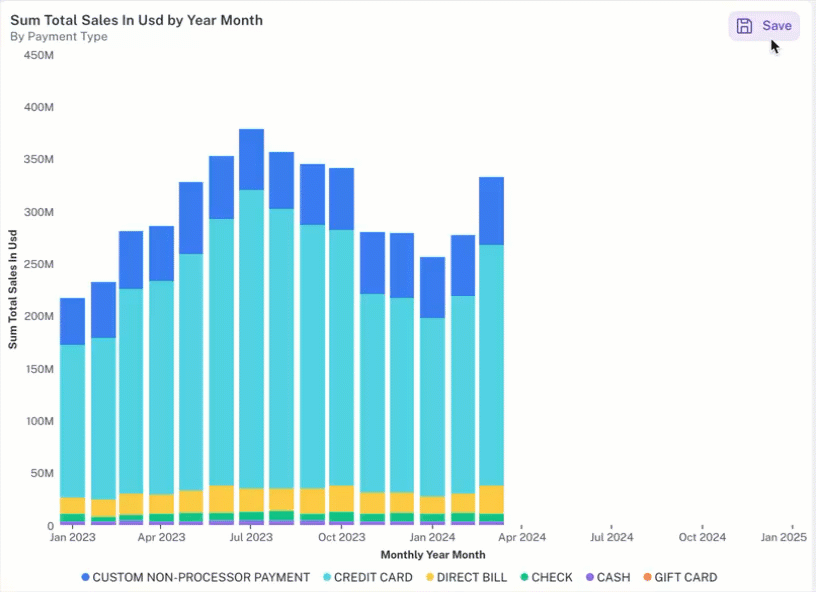
- From the upper right corner of the generated widget, click the Save button.
- Select the Pin to Dashboard option.
- Specify the following details:
- Title
- Description
- Select a dashboard page to pin the widget
- Click the Pin Visualization button. The visualization is successfully pinned to the dashboard. Click the Go to Dashboard button to directly go to the dashboard page and view the pinned visualization.
Was this helpful?